
Before the harvest
I started by looking at whether satellite observations could help measure what heatwaves and other disasters were doing to crop growth and yields. An early estimate was the aim, while there was still a season left to observe, rather than an explanation assembled after the harvest. The work developed from a five-region French maize pilot into a broader regional production-index study, and phase one is now archived: there are some retrospective July improvements, but no model was promoted and the most important drought failure remains unresolved.
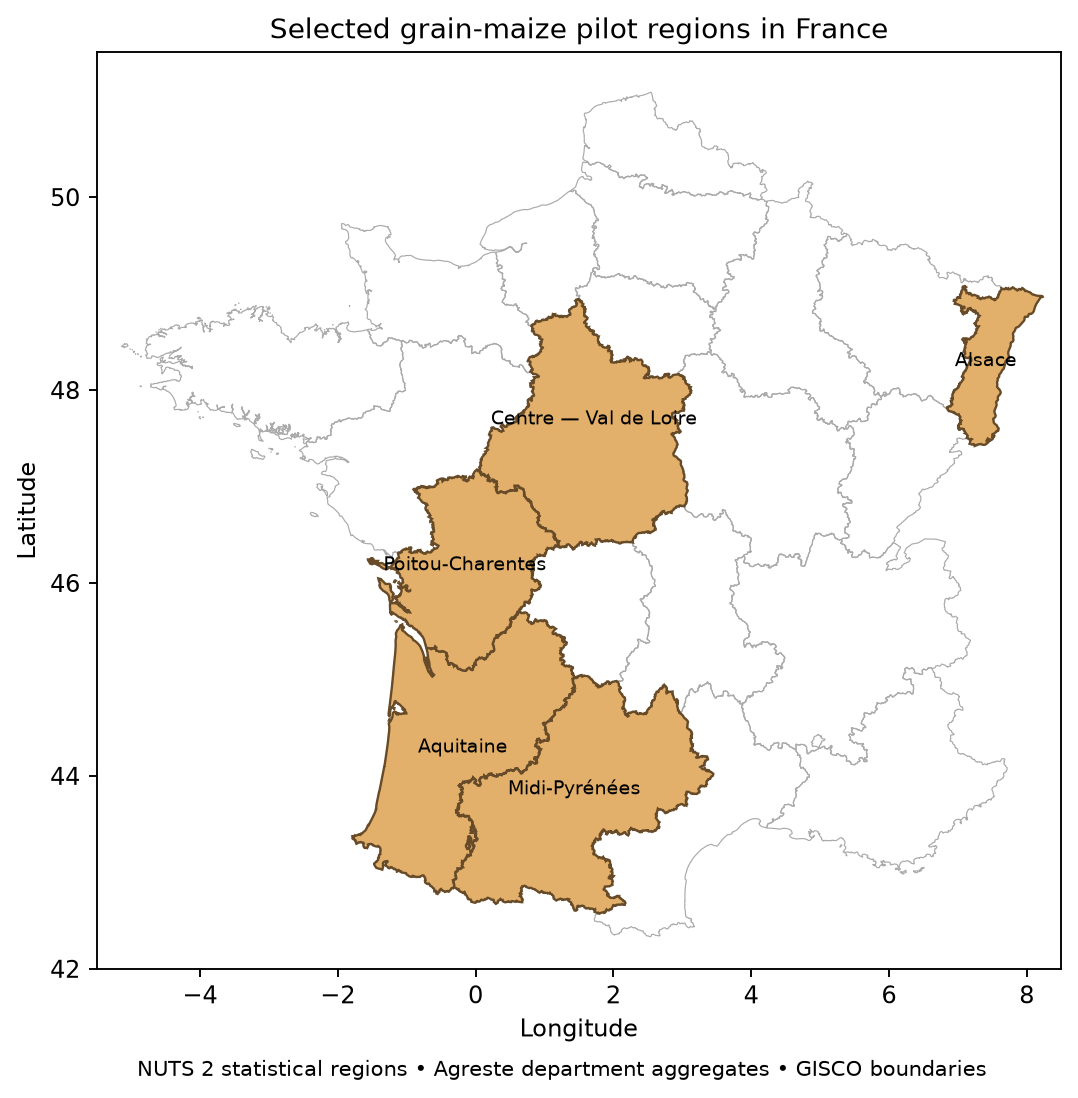
Maize gave the initial forecast a specific target: annual grain-and-seed yield in tonnes per hectare across the five regions shown above. Weather-only and historical-trend models stayed beside the satellite versions, because a plausible-looking forecast would tell me very little unless the imagery improved that comparison. The later target was one regional index of overall crop-production impact, with the earliest reasonably accurate forecast as the goal and July the priority. That is a broader question than the yield of one crop, so it needed a separate target and evaluation rather than another maize model with a different title.
Know your crop
The inputs included official agricultural statistics, NASA POWER weather, Sentinel-2 optical observations and Sentinel-1 radar, but each described a different part of the problem. A historical maize mask showed where maize had been grown, and crop rotation meant that was not necessarily maize in the year being forecast. Grain maize, seed and silage also had different definitions across the labels and reference statistics. Missing satellite observations had to remain missing rather than becoming zero vegetation, otherwise the pipeline would manufacture a change in crop condition.
The measurement pilots therefore checked the imagery against same-year crop declarations and dated regional condition reports, instead of treating green pixels as validated crop health. A cleaner grain-maize cohort could be reconstructed for Centre in 2024 and 2025, but the greenness summaries still did not establish the expected positive relationship with the regional ratings. Those two seasonal trajectories were useful for checking crop identity and the image-to-index arithmetic; they were not independent field-health labels, and they did not establish a better regional yield forecast.
For the legacy maize forecasts, fitting used earlier seasons only, with weather ending seven days before the month-end issue and the same region-years compared across models. May through September stayed visible alongside the primary July check, including a sensitivity excluding provisional 2025. The broader production study used two- and three-year delays for annual outcome labels, because a historical model should not train on figures published later. Independent forecasts also stayed separate from versions allowed to use current official estimates. These controls made the comparisons auditable, although a current archive still could not establish which version of every input existed at the original forecast date.
Pixels to predictions
The original maize pipeline turned heat, growing degree days, rainfall and dry spells into weather features, alongside optical vegetation indices and radar summaries from monitoring windows. A window covered several parcels rather than one verified field. Its measurements were weighted and aggregated through departments to regions, and a regularised regression estimated a percentage departure from historical yield trend before reconstructing tonnes per hectare. For the held-out July 2023 Alsace example below, the input transformations and fitted contributions all come from earlier-year training; adding those contributions back to the trend produces the forecast that can then be checked against annual yield. That separation made it possible to inspect the arithmetic without calling a fitted heat coefficient a causal heat effect.
A clearer picture
Image frequency and resolution were early constraints, and I considered PlanetScope as another source, but I did not have an account and its usable archive was not established. The public Sentinel work continued with explicit checks on clouds, observation age and sample support. Radar provided another measurement path when optical observations were missing, but it measured microwave scattering rather than reconstructing a cloud-free vegetation image, and the sensor comparison did not establish a July yield improvement.
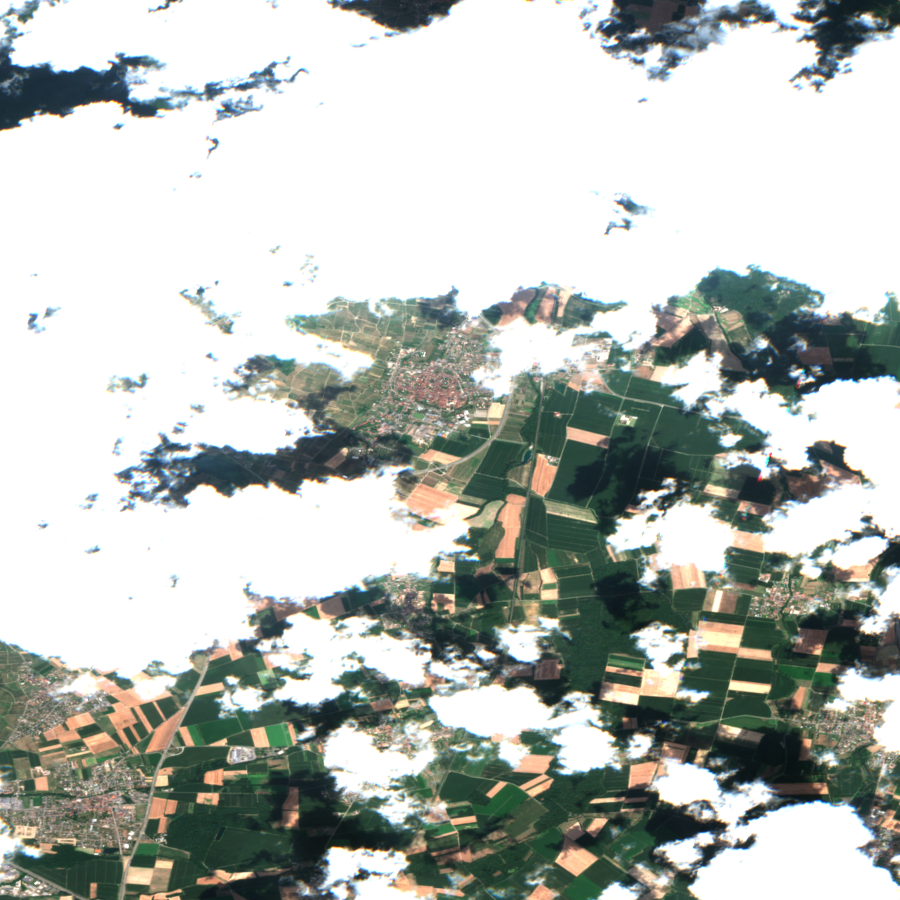
The optical timing experiment tested whether old or incomplete observations were limiting the forecast. A latest-in-month recipe increased observed July mask weight from 94.7% to 99.5% across the sampled historical sites and reduced mean image age from 12.9 to 5.8 days, so the sampled observations became more complete and recent. Those figures describe the sampled windows rather than the percentage of all regional maize land observed, and July forecast error still worsened from about 0.828 to 0.839 tonnes per hectare. More recent pictures had addressed one problem without establishing useful information about the eventual harvest.
Weather permitting
The weather model was still using one point in each of 25 departments while the satellite sample had expanded to 150 windows, so I tested weather at those windows with the satellite inputs, targets and model settings held fixed. Across 20 matched region-years in 2022–2025, July weather-only MAE fell from 0.816 to 0.808 tonnes per hectare, and from 0.895 to 0.883 when provisional 2025 was excluded. The satellite fusion version remained worse than expanded weather-only at about 0.819.
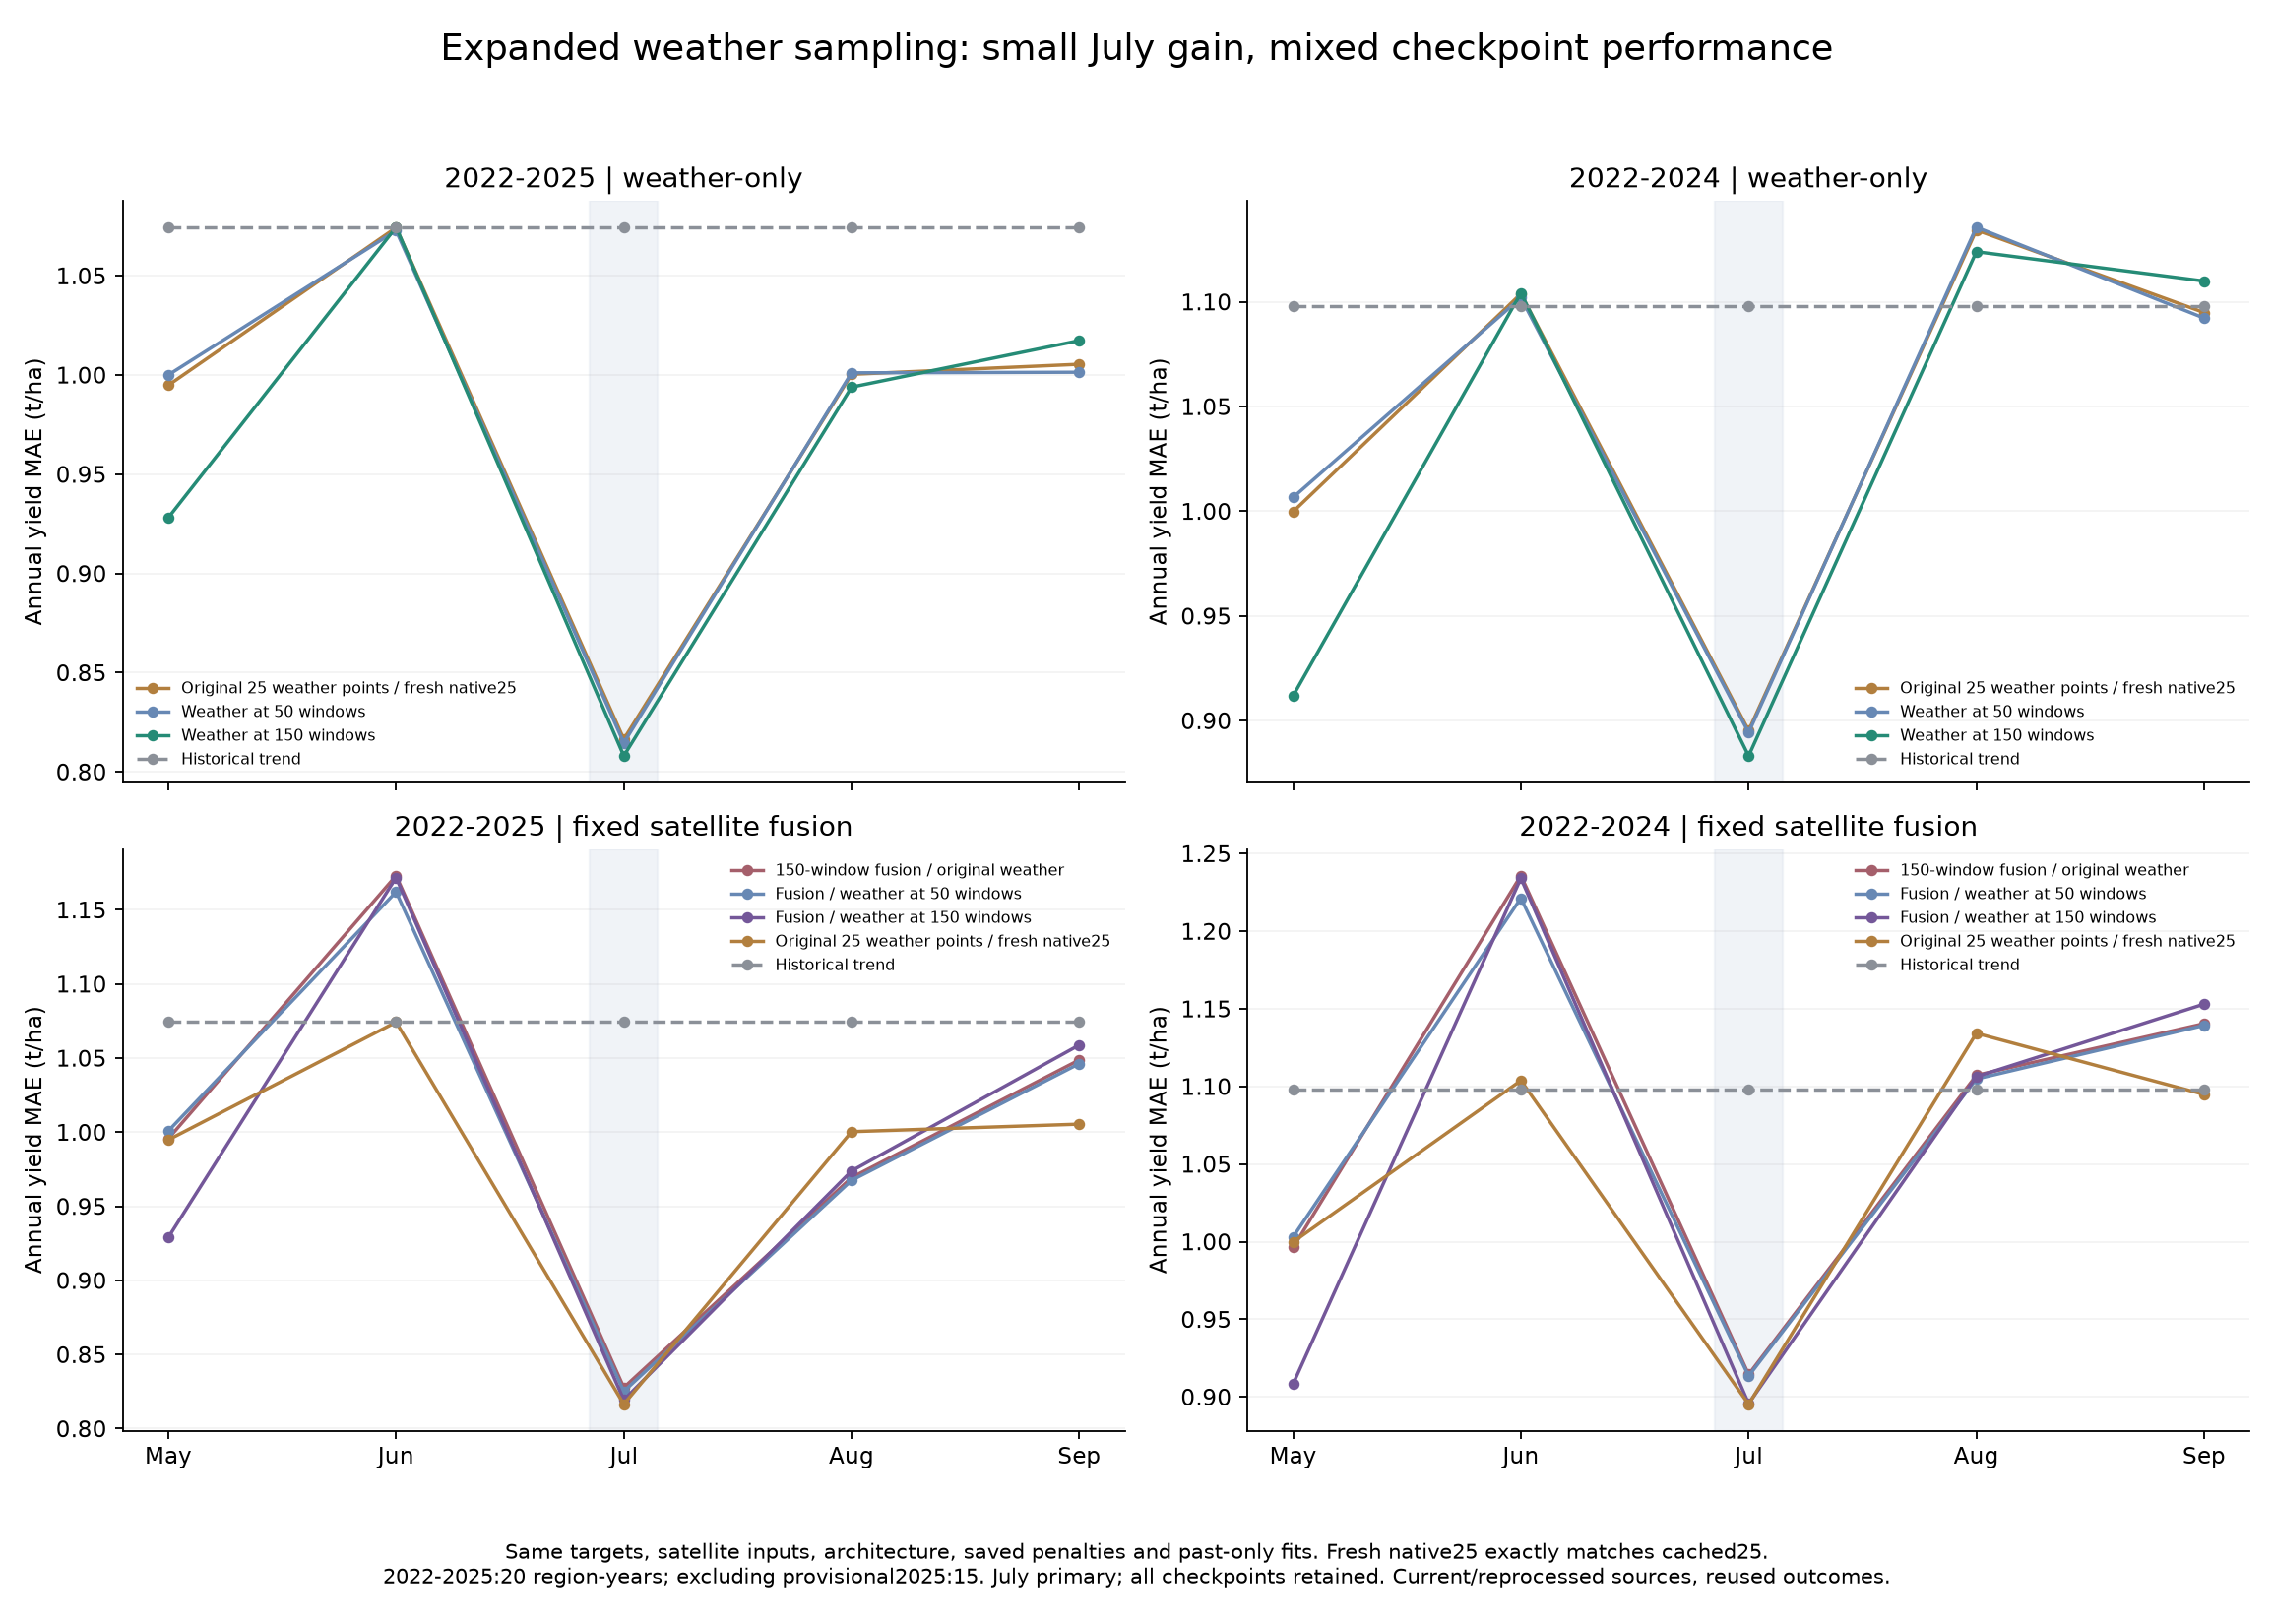
The gain was small, varied across regions and years, and did not hold at every issue date, with September getting worse. A later diagnostic separated changed forecast-year exposure from changed calibration and showed that swapping the new weather inputs into the old fit did not reproduce the gain. A climate-based scaling repair reduced extreme standardised inputs but worsened forecast checks, so it was rejected rather than adopted because the intermediate features looked more reasonable.
Beyond maize
The broader objective was one overall production-impact index for a region, rather than separate forecasts for a growing list of crops. The official plant-output account supplied that target, combining cereals, forage, vegetables, fruit, wine and other outputs using economic weights. An index of 89.3 means production volume fell 10.7% from the preceding year; it is neither summed tonnes nor yield per hectare, and price inflation is not the measured change. A heatwave could contribute to that outcome, but predicting the index would not by itself identify how much of the loss the heatwave caused.
For this track, the satellite inputs were cropland and rangeland FPAR, the fraction of incoming photosynthetically active radiation absorbed by vegetation. That is a different measurement from the maize greenness indices. The direct models combined seasonal vegetation summaries and weather to predict the annual regional change, with a follow-up comparing vegetation at matching calendar periods across years so ordinary seasonal growth was not treated as an unusual improvement. Raw aggregate levels had performed worse than the retained baseline, and more detailed economic crop shares had not fixed that; those shares describe a region’s production mix, not the identity of each observed field.
I evaluated Centre-Val de Loire, Pays de la Loire and Bretagne as three exact regional matches, separately from a seven-region extension whose merged-region benchmarks needed approximate combinations of older regional forecasts. On the three exact regions, July MAE fell from 6.466 to 5.912 percentage points of annual production change under a two-year label delay, and from 6.674 to 5.978 under a three-year delay. Each delay covered the same 27 region-years in 2017–2025, with 2024 semi-final and 2025 provisional, and the gain remained when 2025 was removed. MAE is the average absolute forecast error, so lower is better. The all-crop issues were 1 April, 1 June, 1 July, 1 August and 1 October; July took priority, but an improvement there did not replace the checks at the other dates.
A recent-stress research model gave a lower July error of 5.649 points on those exact regions under the two-year delay, but the result varied with the date, region set and label delay, and none of those comparisons supplied a fresh validation sample. The more serious issue was timing: a ninety-day holdback removed the July gain from calendar vegetation changes, and the archive could contain later processing or smoothing. That did not prove that the information was always ninety days late, but it did show why an acquisition-date cutoff alone was insufficient to claim an early forecasting advantage.
Missing the drought
Bretagne in 2022 was the case that average error could hide. Actual annual crop production fell 10.7%, with forage contributing −6.77 percentage points and horticulture and vegetables another −2.88, while the retained July baseline predicted a 1.49% increase. The earlier calendar model predicted +5.77% and the recent-stress version +7.89%, so their better average scores did not repair the wrong sign in that damaging year.
The case audit found damage already present by late June and a later period when grass growth stopped, while heat, drying winds, irrigation constraints and marketable vegetable quality complicated the relationship between canopy measurements and production. The weather inputs contained the drought, but the broad vegetation summaries and fitted output mapping did not recover the cumulative forage loss. Some reports explaining that sequence were published in September, so they could help diagnose the July miss without being quietly fed back into the July model.
Time to stop
I packaged phase one on 18 November 2026 and put further model development on hold pending new evidence. There was enough here to preserve the measurement audits, the conditional retrospective gains and the failure cases, but another round of tuning on the same inspected years would still leave the early-forecast claim unresolved. No candidate was promoted. A separate source-copy-gated July replay was also too small to settle it: just six region-year cases per label delay, using a different crop-only recipe, with revised weather and outcome labels still limiting the comparison.
The restart conditions concern the data behind the claim: usable satellite vintages with actual availability and revision stages, source-compatible production targets and crop scope, and stronger forage observations and timing. A longer source-consistent history or prospectively collected inputs would let a future model face a genuinely new comparison. Finer imagery or another favourable score on the same seasons would not, on their own, resolve the failures identified here.